Small business statistics covering the U.S. landscape are everywhere. But which ones matter (and which ones are true)? Here are some key small business stats entrepreneurs want to know about this year. From employment to inflation to top challenges and more, we’ve covered it all with reliable sourcing you can count on.
-
Key Takeaways
Which employment statistics about small businesses are true? Here are a few small business stats you can take to the bank:
- 33.2 million: Small businesses in the U.S.
- 46.4%: Workforce employed by small businesses
- 1.1 million: New businesses created last year
- 43.1%: Women small business owners
- 51%: Business owners age 55 and older
- $64,000: National average salary for small business owners
- 47.64%: Entrepreneurs opened a business due to dissatisfaction with corporate America
- 60%: Staff hiring and retention and supply-chain issues affecting small business operations
- 63%: Entrepreneurs who plan to raise prices in response to inflation
- 67.6%: Small business survival rate after 2 years
- 42%: No market need for product or service top reason for small business closures
- 62,000: Jobs recently created by businesses with 1-19 employees
- 64.4%: Small businesses that fund their company with personal or family savings
If you’d like small business statistics by state, the Small Business Administration (SBA) offers small business profiles for all 50, from Alabama to Wyoming.
1. What Is the Number of Small Businesses in the U.S.?
At last count, there were 33.2 million small businesses in the U.S., accounting for 99.9% of the total number of companies in the U.S., according to the latest small business statistics from 2022 provided by the SBA’s Office of Advocacy. The number of small business owners in 2022 represented an increase from 2021, when there were 32.5 million.
2. How Many U.S. Jobs Do Small Businesses Create?
Knowing how many small businesses in the U.S. there are wouldn’t be enough without knowing how many people these businesses employ. In 2022 alone, U.S. small businesses employed 61.7 million people, according to the SBA. This accounted for 46.4% of the private workforce in the U.S.
The top 10 industries that provide the largest share of small business employment include:
- Professional, scientific and technical services (4.594 million)
- Other services, except public administration (3.554 million)
- Construction (3.483 million)
- Real estate and rental and leasing (3.268 million)
- Transportation and warehousing (3.051 million)
- Administrative, support and waste management (2.946 million)
- Retail trade (2.734 million)
- Health care and social assistance (2.723 million)
- Arts, entertainment and recreation (1.7 million)
- Accommodation and food services (1.048 million)
3. How Many Small Businesses Start Up Each Year?
In terms of small business growth statistics, 1.1 million businesses opened between March 2020 and March 2021, according to the SBA. The year prior, 1 million businesses opened.
These figures, however, are set off by closures, which accounted for 965,995 in the most recent year and 993,809 the previous year, leading to a net increase of 180,528 and 42,650 small businesses, respectively.
The number of small businesses starting up increased in response to the coronavirus pandemic and continues to grow. This recent rise in small business start-ups stands in contrast to a long-term decline in new enterprises. From 1978 to 2012, the number of new companies as a share of all businesses fell by 44%, according to an analysis of Census Bureau data by the Kauffman Foundation and Brookings Institution.
4. What Is the Percentage of Small Business Owners by Demographic?
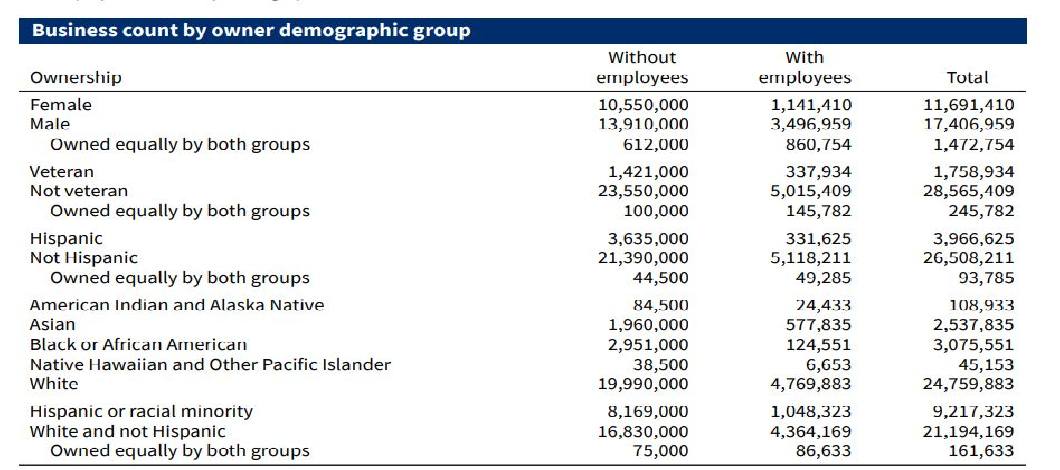
According to the SBA, the following figures reflect percentage breakdowns of business owners by demographic:
- Women (43.1%)
- Racial minorities (19%)
- Hispanics (13.3%)
- Veterans (6.6%)
5. What Are the Age Ranges for Small Business Owners?
Another U.S. small business statistic you might want to know is the average ages of business owners. Referencing 2020 data from the U.S. Census Bureau, here’s the percentage breakdown:
- Age 55 and older (51%)
- Ages 35-54 (43%)
- Ages 34 and under (6%)
Not surprisingly, Baby Boomer and Gen X populations make up a large portion of entrepreneurs.
6. What Is the Average Salary of a Small Business Owner?
According to ZipRecruiter, the average salary for small business owners nationwide is approximately $64,000 as of Nov. 2022. However, this varies greatly by location, so ZipRecruiter has compiled average salaries by state.
The state with the highest annual salary is New York, where it’s just shy of $71,950, more than 12% above the national average. In contrast, the state with the lowest annual salary is North Carolina, where small business owners earn just above $45,420.
7. What Are the Reasons People Start a Small Business?
In terms of small business vs. large corporation statistics, people often go into business for themselves for the following reasons, according to a survey by Guidant Financial:
- Want to be their own boss (60.87%)
- Dissatisfied with corporate America (47.64%)
- Motivated to pursue their passion (31%)
- Opportunity presents itself (21.36%)
- Newly unemployed (23.44%)
- Not ready to retire (20%)
8. What Are the Greatest Operational Issues Facing Small Businesses?
According to the most recent Federal Reserve Banks’ Small Business Credit Survey, the most cited challenges small business owners face include the following:
- Staff hiring and retention (60%)
- Supply-chain issues (60%)
- Customer reach and sales growth (53%)
- Government regulatory compliance (40%)
- Customer and employee health and safety concerns (38%)
- Technology usage (26%)
9. How Is Inflation Affecting Small Businesses?
In addition to everyday operational issues affecting small businesses, inflation is a top concern for many. Indeed, another small business stat to keep in mind is that 35% of entrepreneurs are concerned about how inflation will impact their sales, according to the most recent Verizon Small Business Survey.
In response, 63% of small business owners plan to raise prices, according to a PNC survey. Furthermore, 69% are making other changes, such as cutting costs, managing cash flow better and increasing efficiency.
10. How Many Small Businesses Succeed?
Between 1994 and 2018, an average of 67.6% of new businesses, or about two-thirds, survived beyond 2 years, according to long-term tracking of small business facts by the U.S. Department of Labor’s Bureau of Labor Statistics (BLS) and the Census Bureau.
About half of all new businesses survive 5 years or more. One-third survive 10 years or more. A quarter survive the 15-year mark. As this survival rate indicates, the odds of a firm’s survival increase over time, going up once a business has persevered through the challenges of the start-up phase. These business survival rate trends have held consistently across all industries and economic conditions through decades of BLS tracking since 1994.
Related: Why Small Businesses Fail (and How You Can Succeed)
11. What Are the Reasons Businesses Don’t Succeed?
Businesses typically don’t succeed for the following reasons, according to a survey by business analytics provider CB Insights:
- No market need for the company’s product or service (42%)
- Cash-flow shortages (29%)
- Wrong personnel in place (23%)
- Competition (19%)
- Pricing or cost issues (18%)
- Product or service not user-friendly (17%)
- No business model (17%)
- Poor marketing (14%)
- Poor customer service (14%)
- Mistiming of product release (13%)
To the extent these factors lie within the business owner’s control, they can be addressed by preventive measures such as writing a business plan based on solid market research and backed by a viable financing plan.
Of course, unforeseen variables, such as the pandemic, can affect factors such as market demand and cash flow. However, good planning can help you prepare for emergencies.
12. What Is the Unemployment Rate?
As of Oct. 2022 data from the BLS, the unemployment rate is 3.7%. The current number of unemployed individuals is 6.1 million.
That said, private employers added 239,000 jobs in October, up from 192,000 in the previous month, according to the ADP National Employment Report. The breakdown of job growth (or decline) by company size is as follows:
- Businesses with 1-19 workers increased employment by 62,000
- Businesses with 20-49 workers had an employment decline of 37,000
- Businesses with 50-249 workers increased employment by 241,000
- Businesses with 250-499 workers had an employment decline of 23,000
- Businesses with 500 or more workers had an employment decline of 4,000
13. How Are Small Businesses Finding the Financing They Need?
Most commonly, small business startups in the U.S. secure financing from personal and family savings, tapped by 64.4% of small firms, according to a Census Bureau survey. Other popular financing resources are business loans (16.5%), personal credit cards (9.1%) and personal family assets other than owner savings (8.1%).
According to Federal Reserve data, among firms that applied for loans or other forms of financing, 43% turned to large banks, 36% turned to small banks and 23% turned to online lenders.
Use Insights From Small Business Statistics to Stimulate Success
Knowing which small business statistics are shaping the economy can provide insight for making better business decisions about the challenges and opportunities ahead.
Owning a small business often requires having a great financing strategy in place. If you’re a small business owner facing funding challenges or want to expand, consider seeking a business loan. Take a few minutes to fill out our no-obligation online application and find out what types of funding options you may qualify for.


